BigQuery data in Dixa
Show BigQuery customer data inside Dixa conversations, queried live whenever an agent opens a conversation. No ETL, no sync lag, no code.
BigQuery is where a lot of modern product-led companies keep their warehouse of truth: event data, order history, usage, lifecycle state, revenue, internal metrics. Dixa support agents need access to all of this when conversations come in — but BigQuery isn't connected to Dixa by default, so they end up tab-switching to a BI tool or running ad-hoc queries themselves to find the data. A minute here, two minutes there. On a busy shift that adds up to hours.
Ready to show BigQuery data in your Dixa tickets?
14-day free trial · No credit card required · Live in 10 minutes
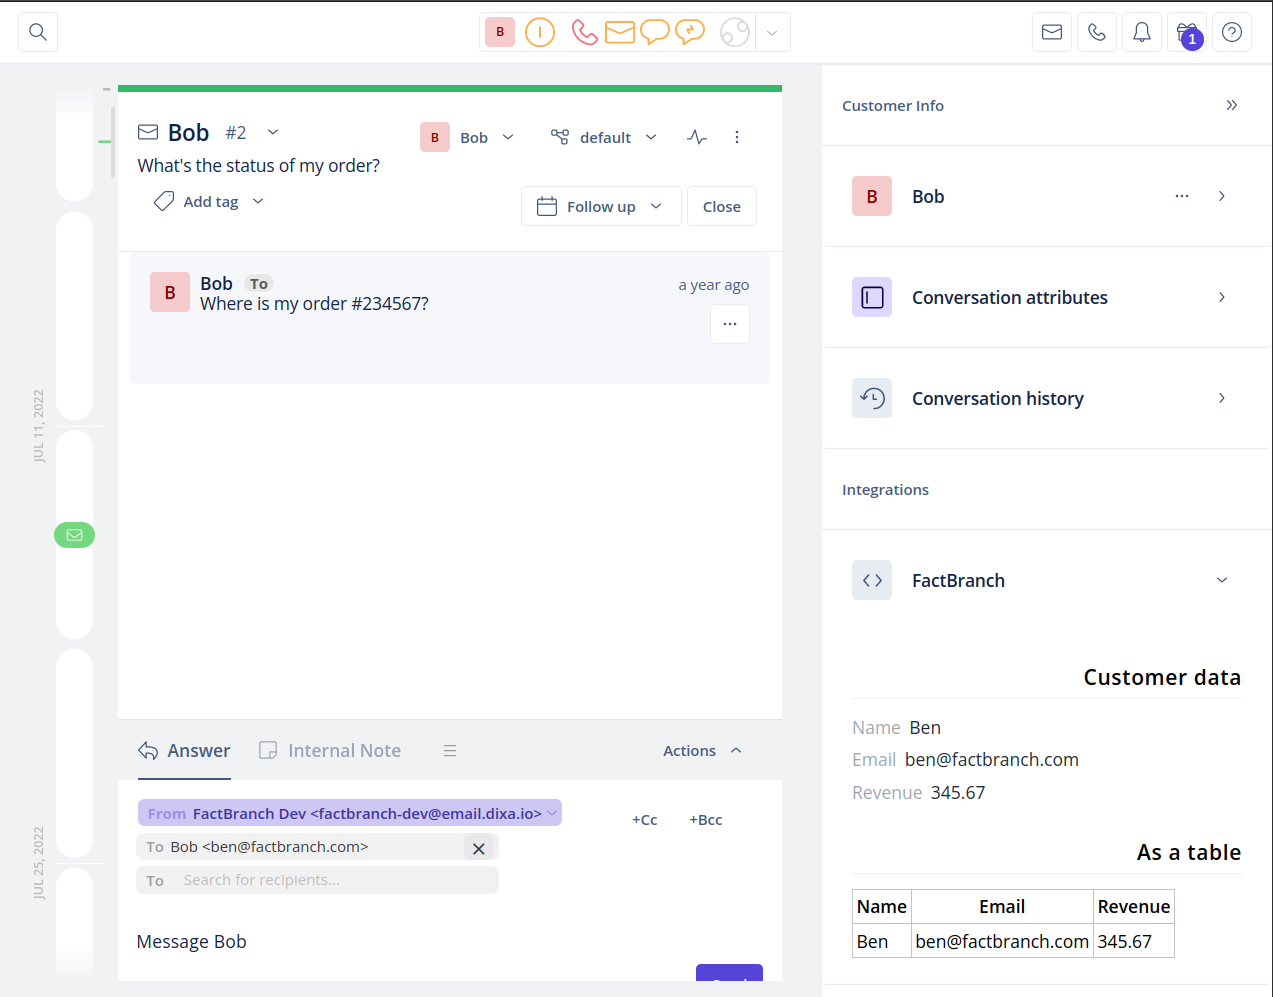
FactBranch fixes that by running a live BigQuery query every time a Dixa conversation is opened, and rendering the result as a Custom Card alongside the conversation. The agent sees the warehouse data they need without leaving Dixa.
How it works
FactBranch is a visual pipeline builder, not an ETL tool. There's no intermediate copy of your warehouse sitting in a third-party database, no sync schedule to tune. Dixa passes the conversation context (requester email, conversation ID, and anything else you want) to FactBranch via a Custom Card webhook. FactBranch runs your SQL query against your own BigQuery dataset, using the conversation context as parameters. The results are rendered into an HTML Card you design.
Each step is a node in the visual editor. You write one BigQuery SQL query and one HTML template. Everything else — the Dixa integration, the authentication, the parameter passing, the rendering — FactBranch handles.
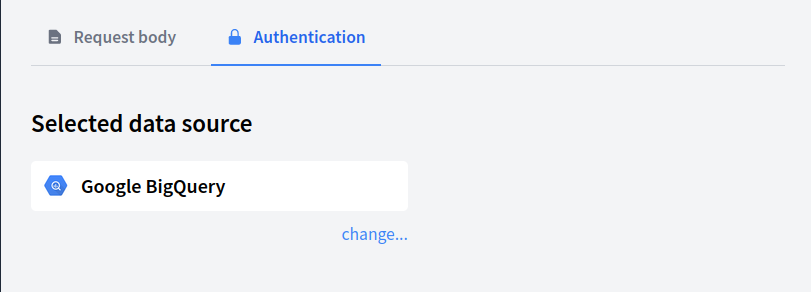
Authenticating to BigQuery
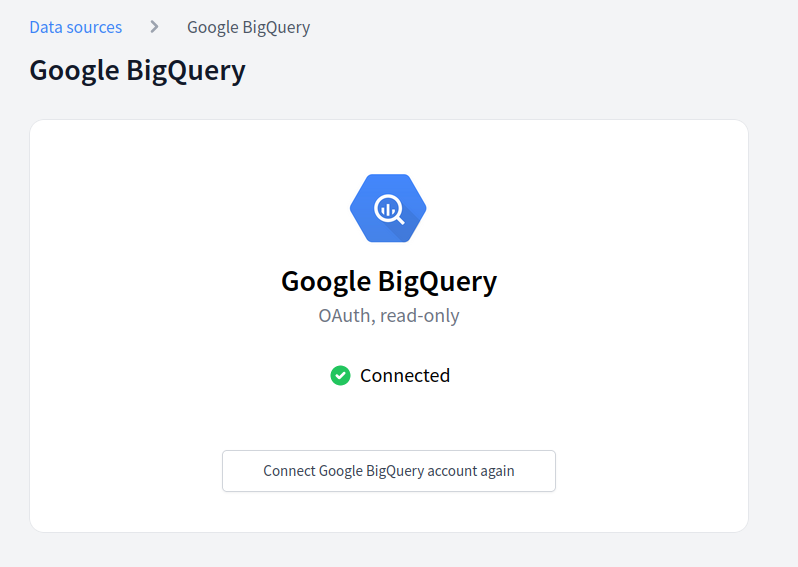
FactBranch authenticates to BigQuery via a Google Cloud service account.
We recommend creating a dedicated service account for FactBranch, scoped to
only the datasets and tables you want to expose, with
roles/bigquery.dataViewer and roles/bigquery.jobUser. Credentials (the
service-account key JSON) are stored encrypted.
Writing the query
You write the query directly against your own BigQuery dataset. Conversation context is available as variables you can reference inline: email, conversation ID, anything else Dixa sends through. Run the query from the editor — and see the exact number of bytes scanned — before you hook it up to the Custom Card.
Because BigQuery bills per bytes scanned, we recommend writing queries that filter by partition keys (usually a date column) and select only the columns you need. For frequently-opened customer queries, materialised views or a small summary table typically keep costs negligible.
What you show is up to you. A typical SaaS support team might surface lifecycle state, last login, weekly active usage, current plan and billing status, or a summary of recent feature usage. E-commerce teams show recent orders, fulfilment status, and lifetime value. If you can write it in BigQuery SQL, you can put it in the Dixa Custom Card.
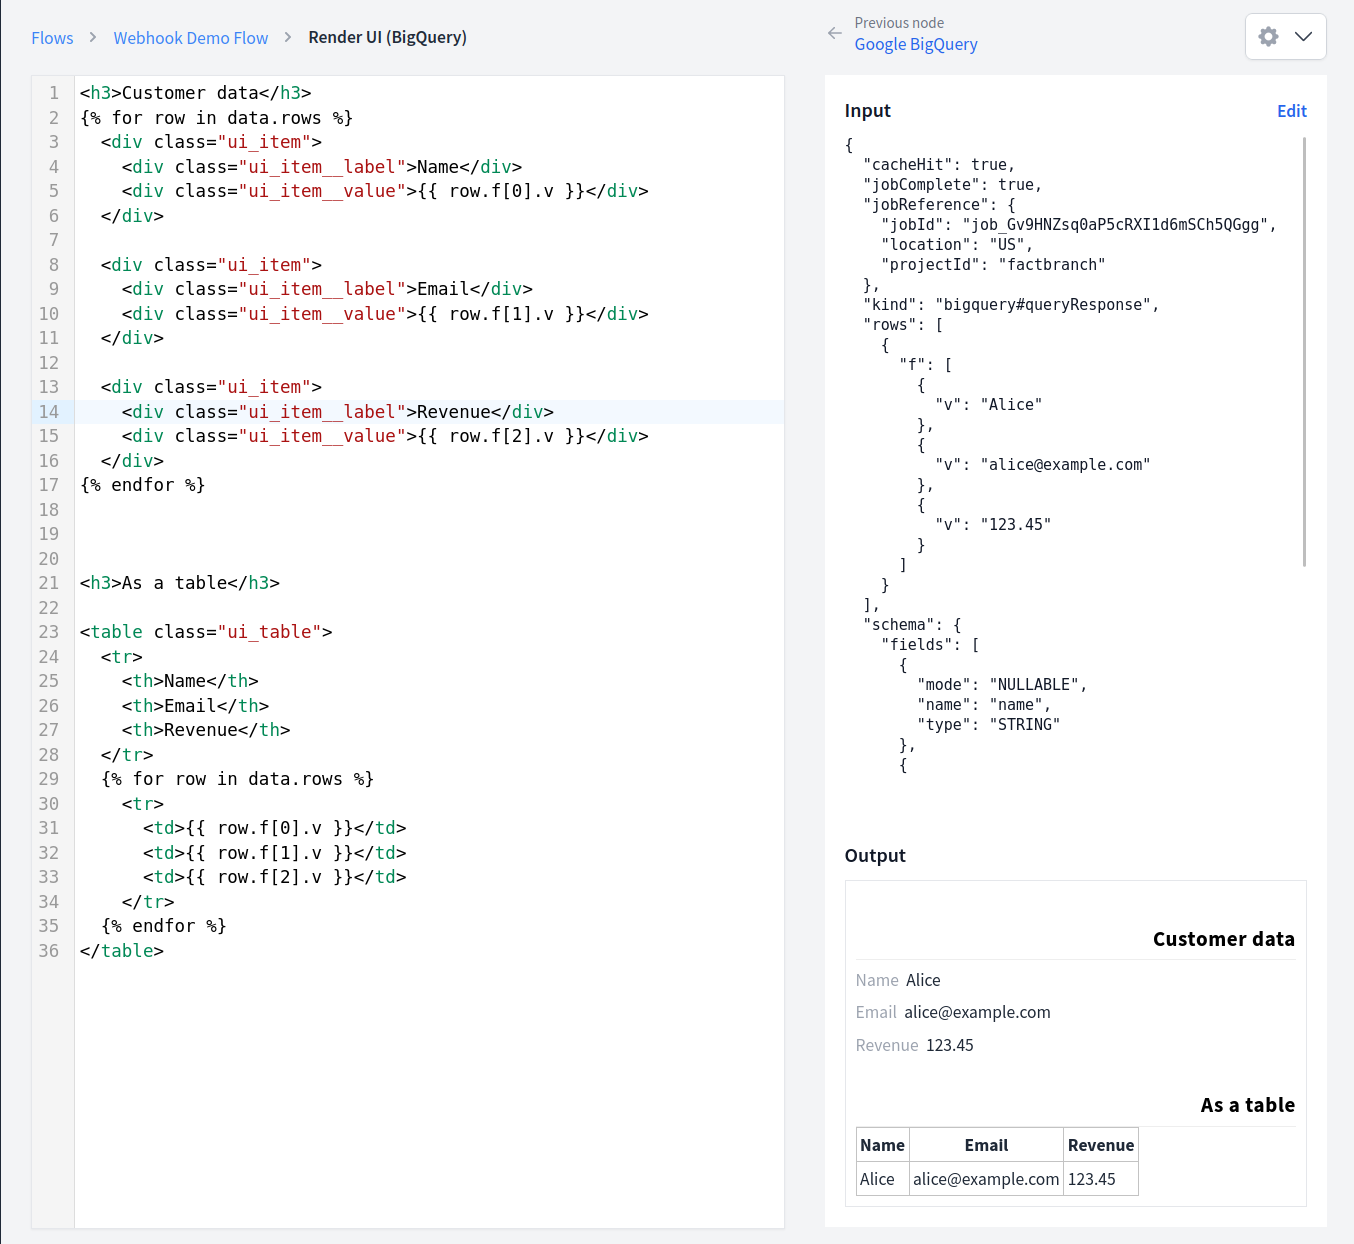
Designing the Custom Card
Once your query returns results, FactBranch pipes them into a display node where you design the Dixa Card. There's a "Generate a UI" button that produces a working HTML template from the shape of your results — a sensible starting point you can then edit. You can tweak the template directly, add conditionals, and style it with CSS. The templating language is Jinja2-compatible.
Keeping it safe
Your BigQuery dataset stays where it is. FactBranch authenticates via a service account scoped to only the datasets and tables you want to expose. Credentials are stored encrypted. We don't cache query results by default, so every conversation gets a fresh read; there's no stale data to worry about, and no long-lived copies of your warehouse in our systems.
Setup
Most teams are live in about 15 minutes. Create a free FactBranch account, connect a BigQuery service account, write the SQL query you want the Card to run, and design the Card layout in the display node. The final step is adding the FactBranch Custom Card URL in your Dixa settings — agents see the Card on the next conversation they open.
See the full walkthrough in our Dixa Custom Card documentation or watch a support agent use the sidebar in practice.
Ready to show BigQuery data in your Dixa tickets?
14-day free trial · No credit card required · Live in 10 minutes