Google Sheets data in Dixa
Show Google Sheets customer data inside Dixa conversations, read live whenever an agent opens a conversation. No ETL, no sync lag, no code.
Google Sheets is often the "database before the database" — where ops and customer success teams track accounts, partners, commissions, shipping exceptions, churn reasons, anything that hasn't made it into the product yet. When a Dixa conversation comes in that needs data from one of those sheets, agents end up alt-tabbing to Google Drive, opening the right spreadsheet, searching by email or order ID, and pasting the answer back. That lookup costs the team hours per week.
Ready to show Google Sheets data in your Dixa tickets?
14-day free trial · No credit card required · Live in 10 minutes
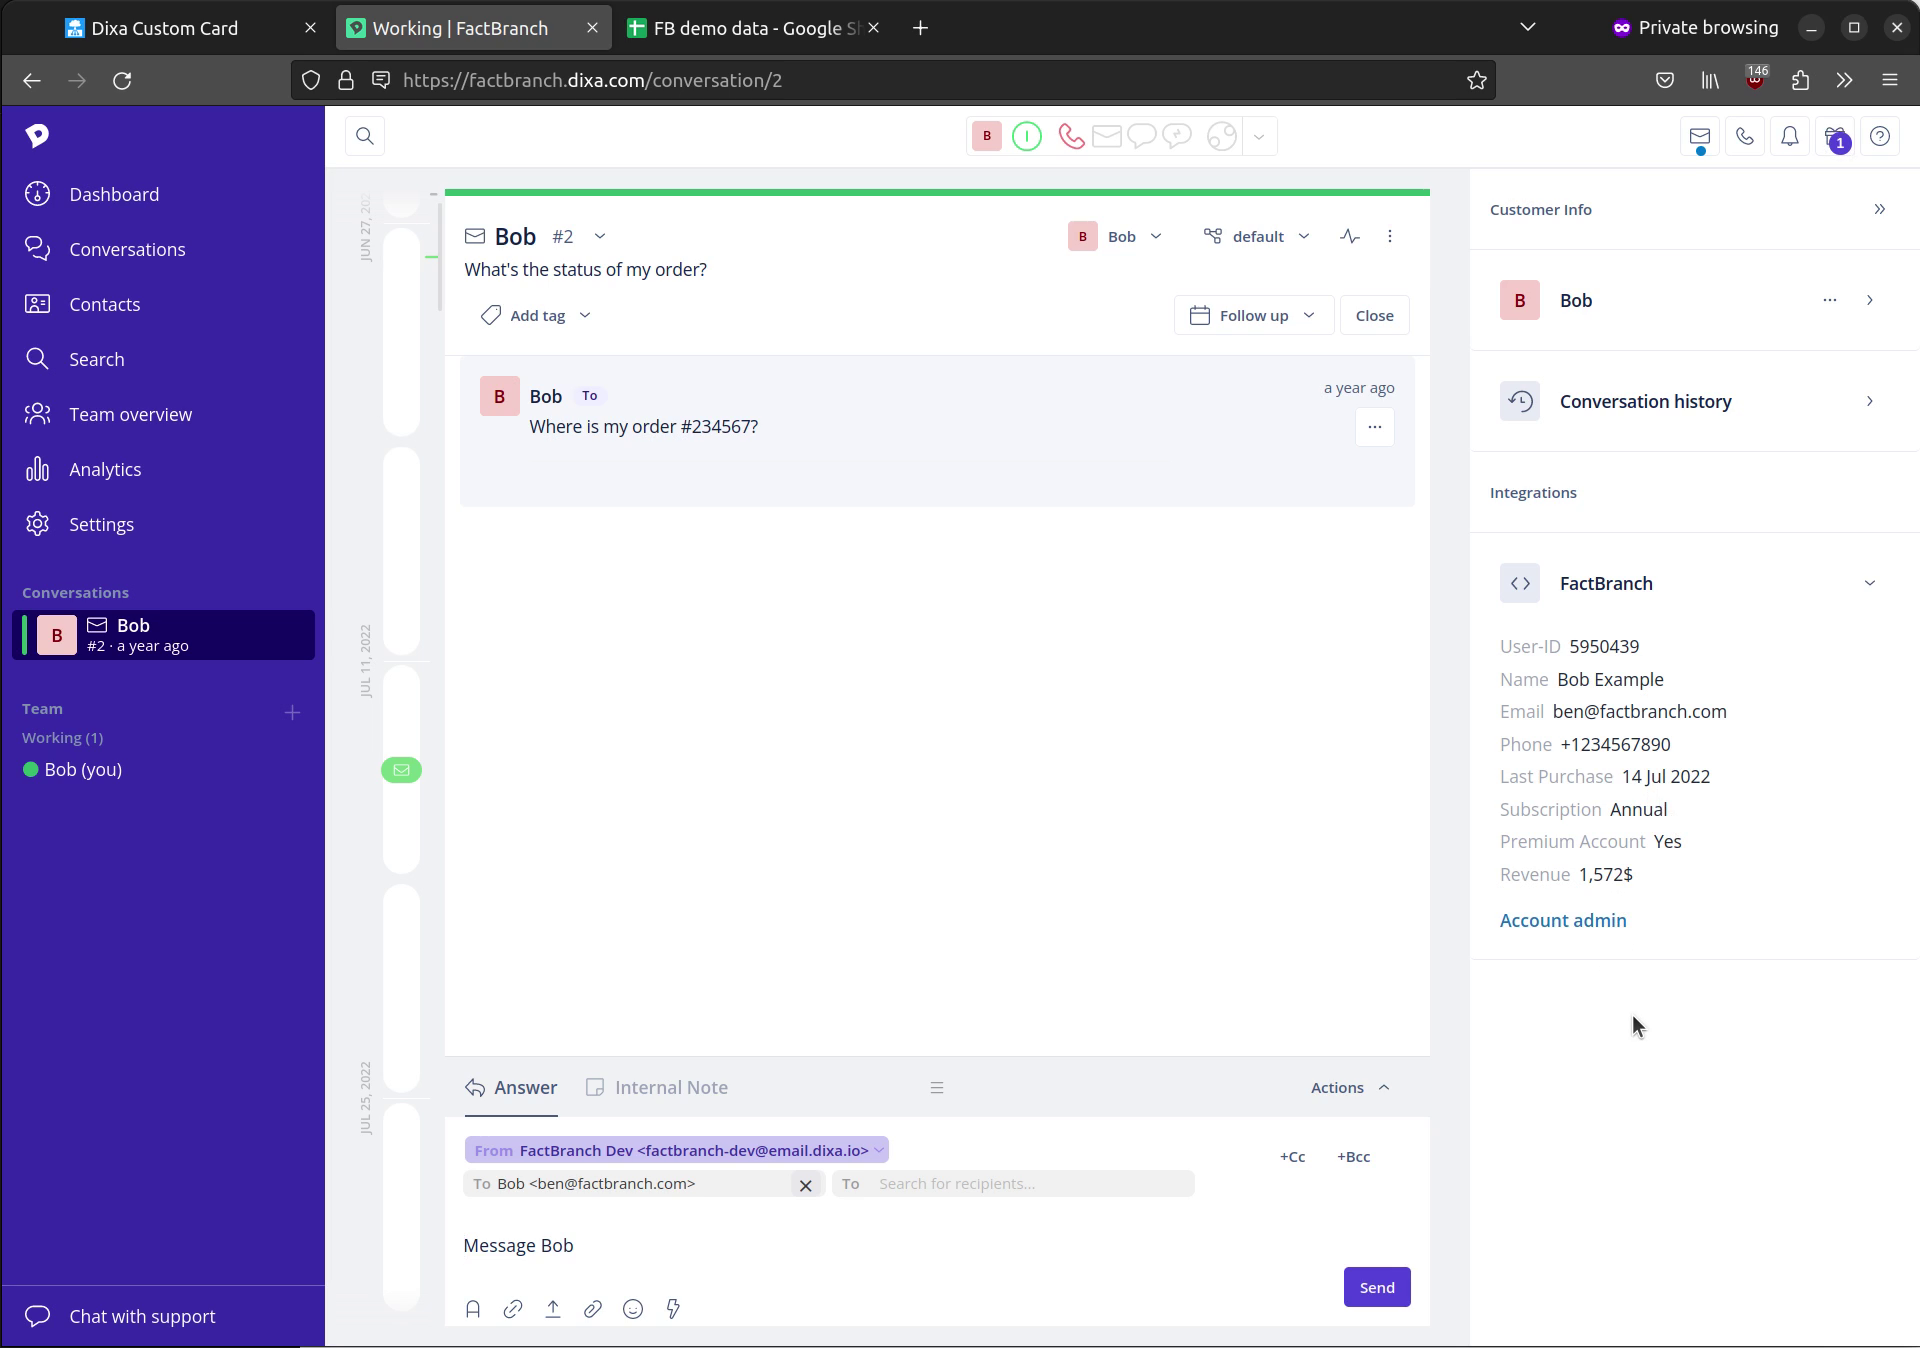
FactBranch fixes that by reading the spreadsheet live every time a Dixa conversation is opened, and rendering the matching row as a Custom Card alongside the conversation. The agent sees the data they need without leaving Dixa.
How it works
FactBranch is a visual pipeline builder, not an ETL tool. There's no intermediate copy of your spreadsheet stored on our end, no sync schedule to tune. Dixa passes the conversation context (requester email, conversation ID, and anything else you want) to FactBranch via a Custom Card webhook. FactBranch reads the relevant range from your Google Sheet, uses the conversation context to filter down to the matching row, and renders the result in an HTML Card you design.
Each step is a node in the visual editor. You pick a sheet and range, write a filter expression, and design one HTML template. Everything else — the Dixa integration, the OAuth handshake, the parameter passing, the rendering — FactBranch handles.
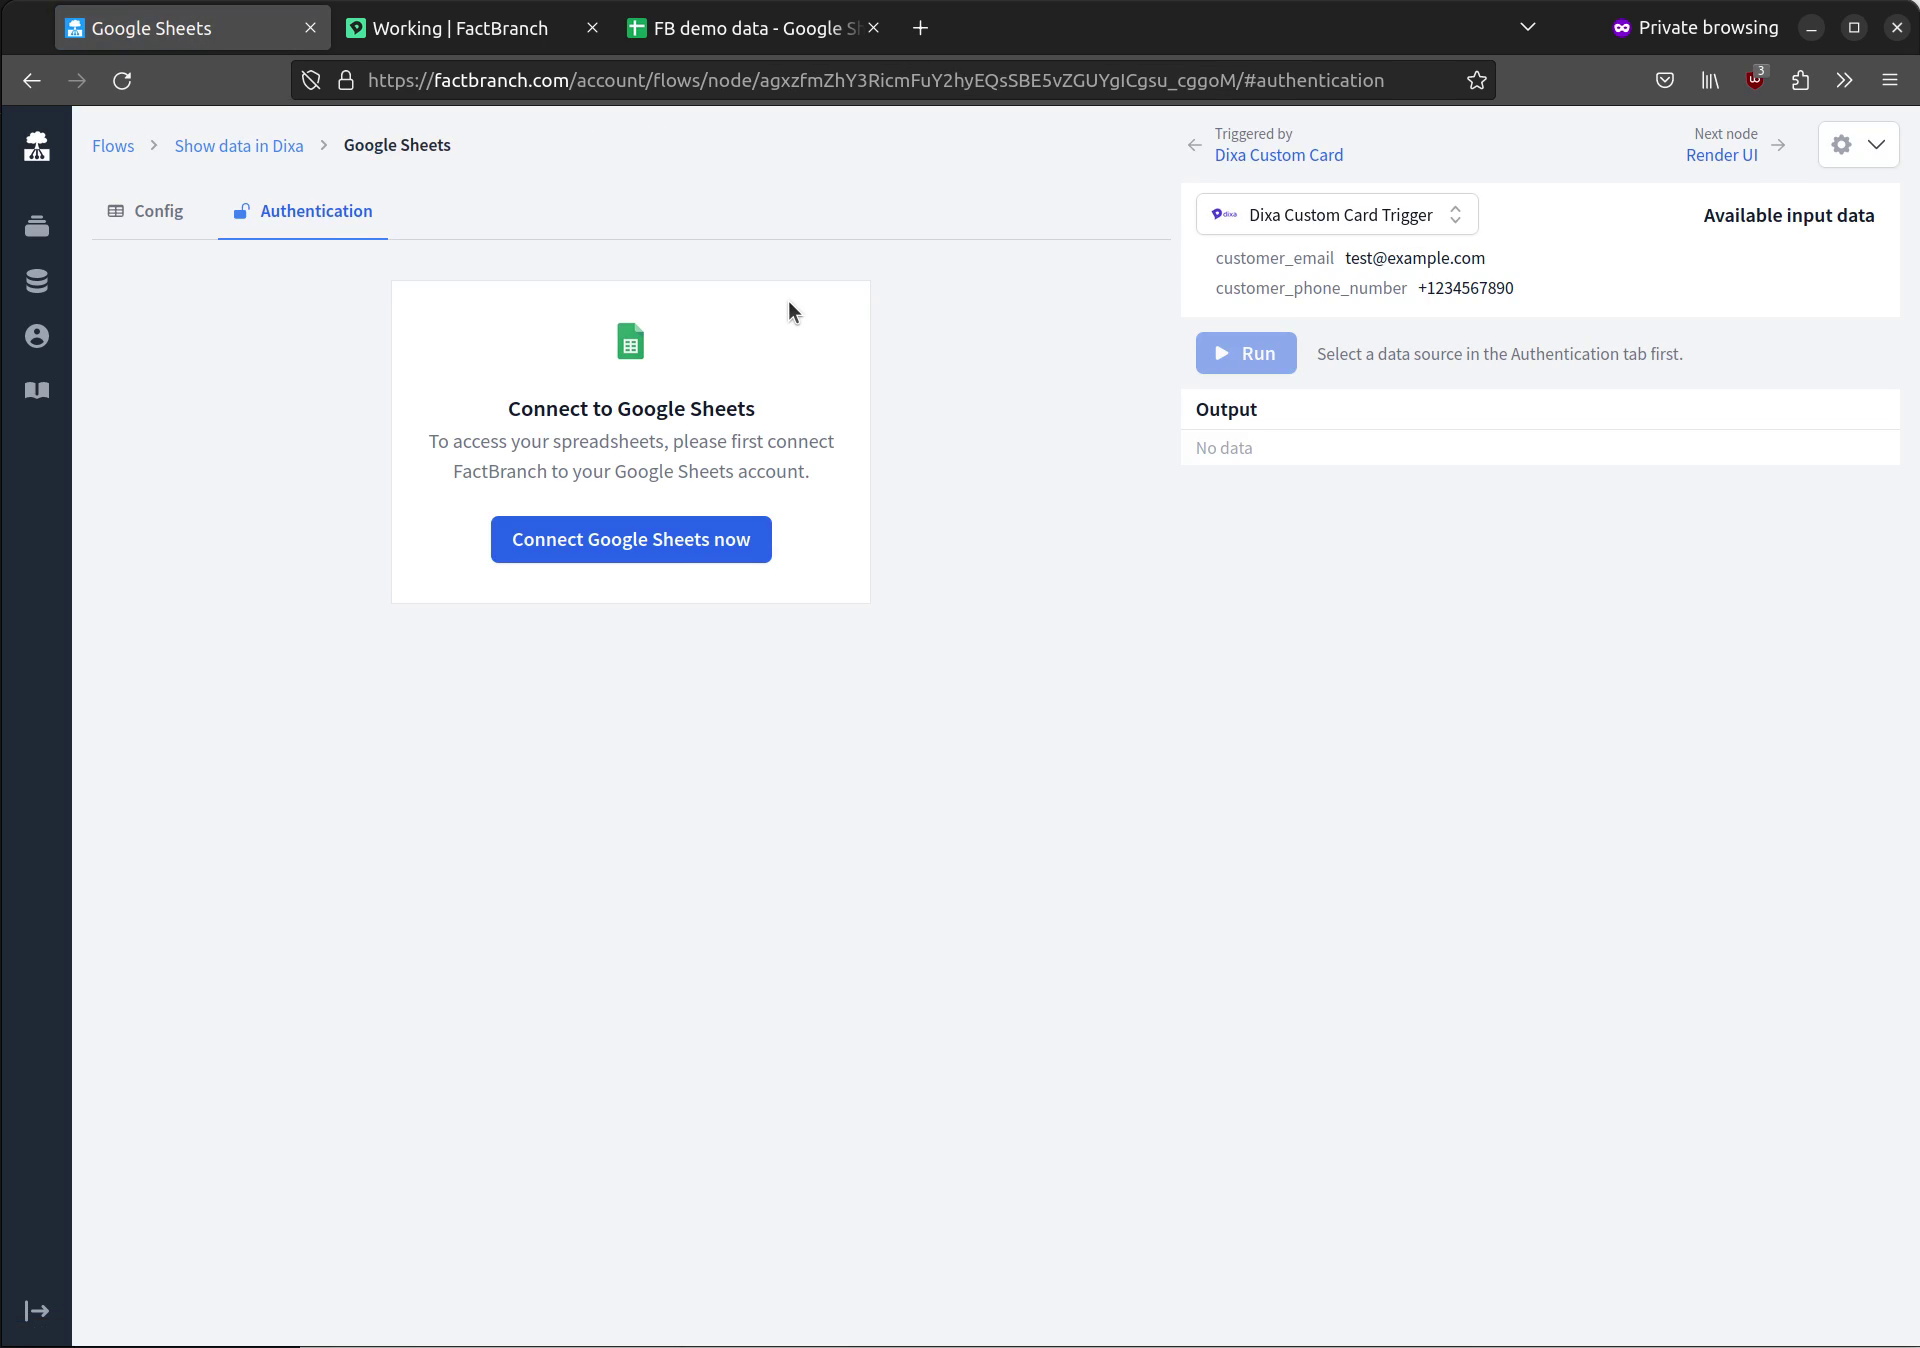
Connecting to Google Sheets
You connect your Google account via OAuth. FactBranch only accesses the sheets you explicitly authorise — we recommend granting access to a dedicated spreadsheet for support lookups rather than an account-wide scope.
Reading from the sheet
After connecting, you pick the spreadsheet, the tab, and the cell range you want to read. FactBranch pulls that data and shows it to you in the editor so you can see exactly what came back. The first row is treated as headers — so the columns you see on the sheet become the fields you reference later.
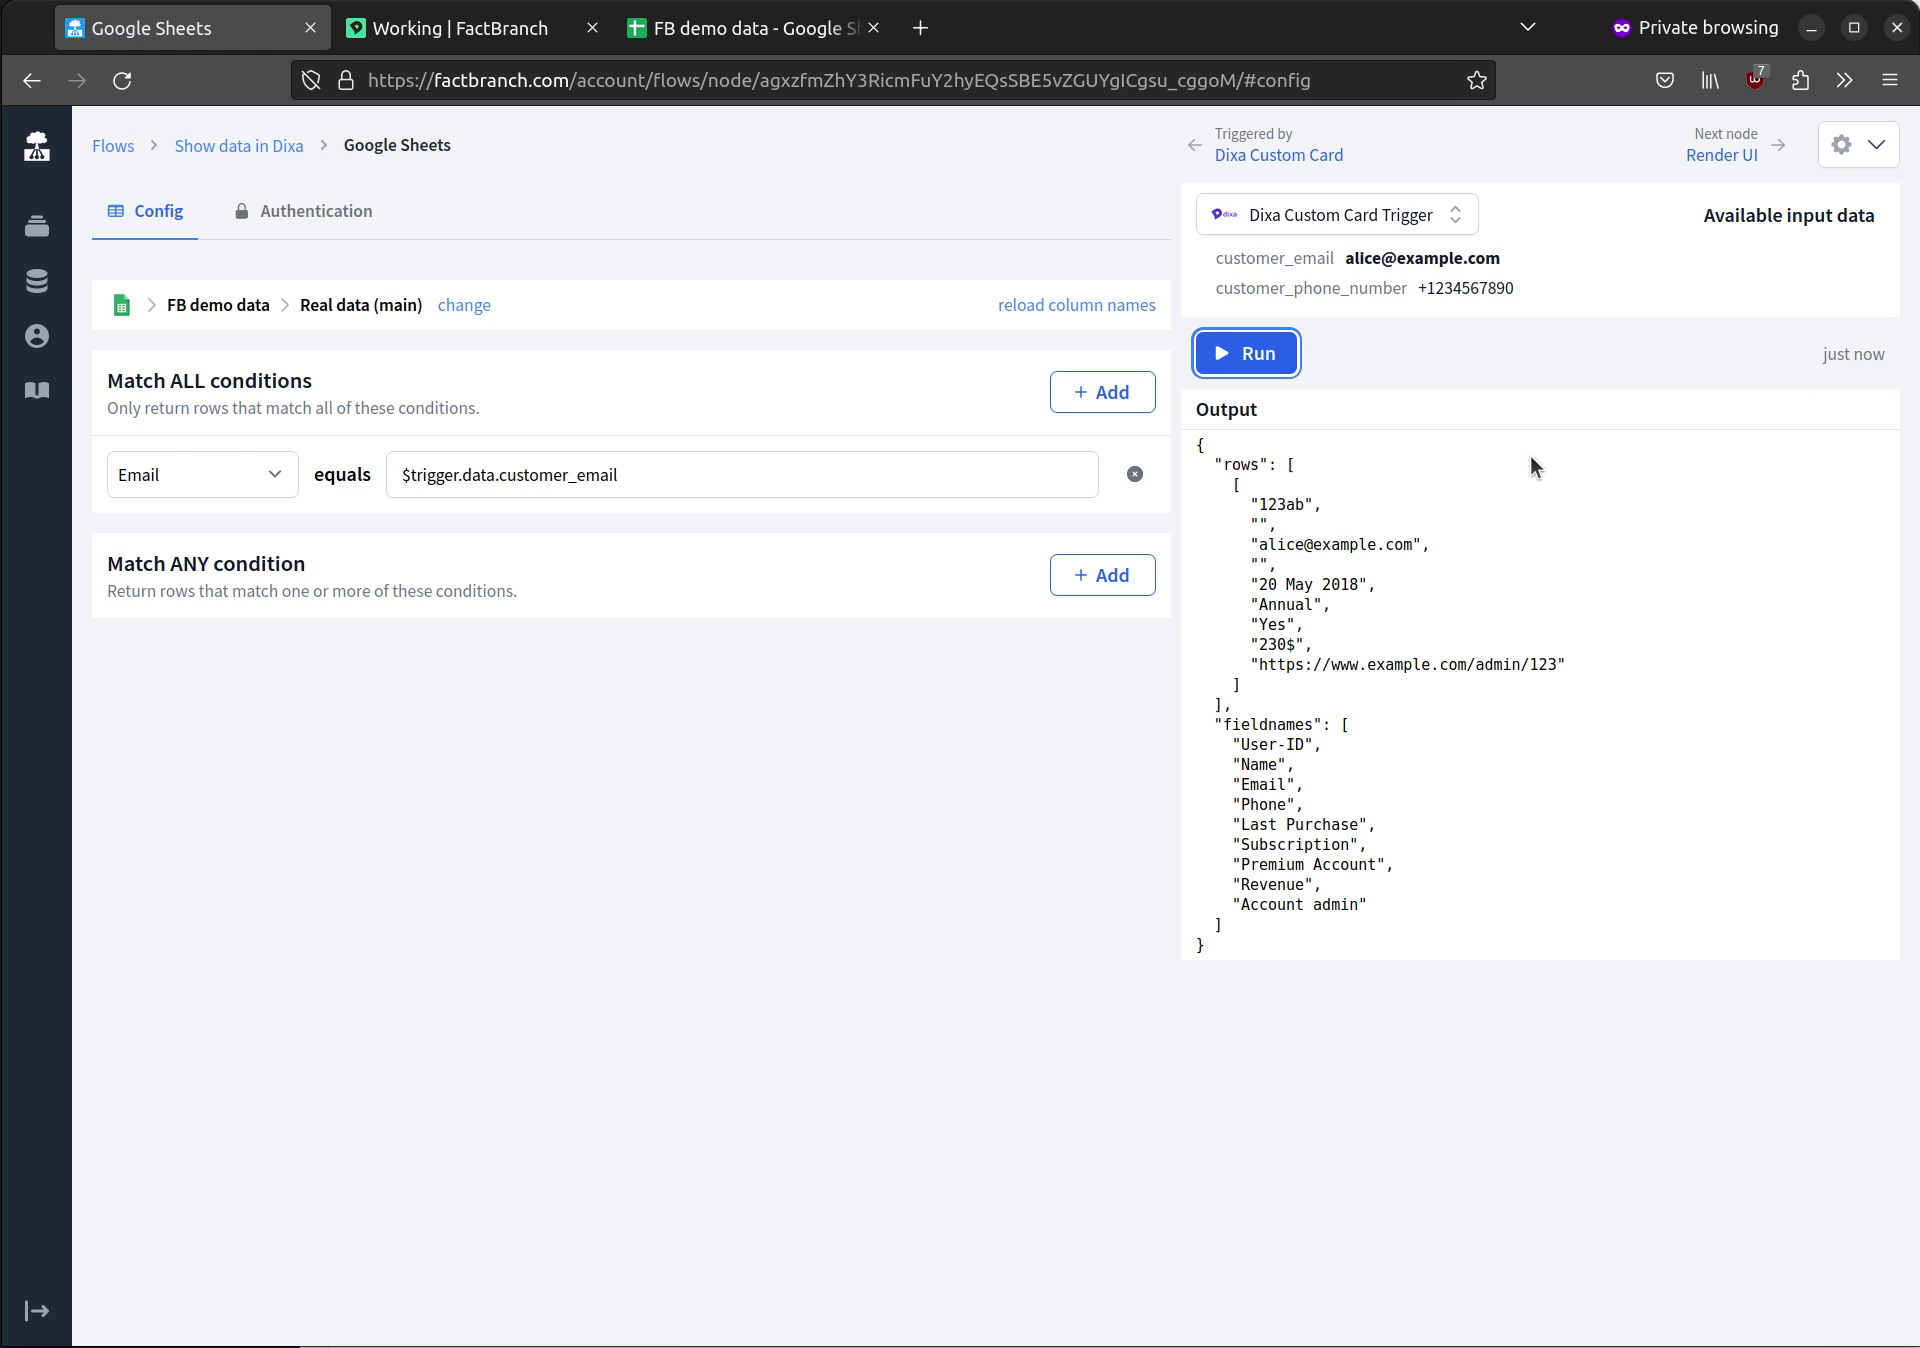
Conversation context is available as variables you can reference to filter the sheet down to the right row: email, conversation ID, anything you've passed through from Dixa. Typical filters are a direct match on an email column or a lookup by account ID, but you can also combine conditions, handle missing rows, and fall back to a default row if the customer isn't in the sheet yet.
Designing the Custom Card
Once you have the matching row, FactBranch pipes the data into a display node where you design the Dixa Card. There's a "Generate a UI" button that produces a working HTML template from the shape of your data — a sensible starting point you can then edit. You can tweak the template directly, add conditionals, and style it with CSS. The templating language is Jinja2-compatible.
Keeping it safe
Your spreadsheet stays in your Google Workspace. FactBranch connects via OAuth and only accesses the sheets you authorise. You can revoke access from your Google Workspace admin at any time.
We don't cache sheet data by default, so every conversation gets a fresh read; there's no stale data to worry about, and no long-lived copies of your spreadsheet in our systems.
Setup
Most teams are live in about 15 minutes. Create a free FactBranch account, connect your Google account, pick the spreadsheet and range, write the filter that matches the conversation's customer, and design the Card layout in the display node. The final step is adding the FactBranch Custom Card URL in your Dixa settings — agents see the Card on the next conversation they open.
See the full walkthrough in our Dixa Custom Card documentation or watch a support agent use the sidebar in practice.
Ready to show Google Sheets data in your Dixa tickets?
14-day free trial · No credit card required · Live in 10 minutes